Loading city directory
Open marketNo verified agents yetData updated 2026-10-30
Moneta, VA: LGBTQ+ friendly real estate guide
A data-first guide to Moneta, VA for LGBTQ+ buyers, renters and people relocating: housing costs, climate, geography and daily life. Every figure carries a numbered source and a retrieval date.
Units
Housing and people in Moneta
U.S. Census Bureau survey estimates for Moneta CDP, Virginia. Each figure shows its margin of error and a numbered source.
- Population
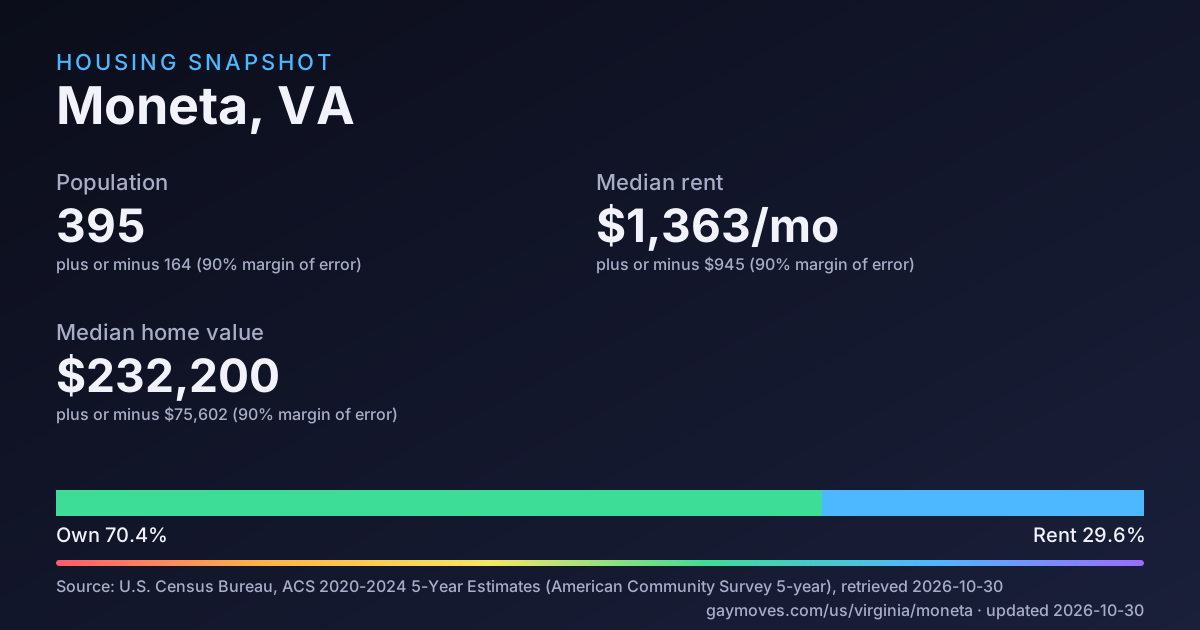
- 395[1]plus or minus 164 · Medium reliability
- Median age
- 37.2[2]plus or minus 26.0 · Low reliability: small sample
- Households
- 213[3]plus or minus 87 · Medium reliability
- Average household size
- 1.85[4]plus or minus 0.64 · Medium reliability
- Median home value
- $232,200[5]plus or minus $75,602 · Medium reliability
- Median gross rent
- $1,363/mo[6]plus or minus $945/mo · Low reliability: small sample
- Owner-occupied share
- 70.4%[7]plus or minus 21.9% · Medium reliability · Calculated from published cells
- Family households
- 44.6%[3]plus or minus 12.4% · Medium reliability · Calculated from published cells
Home values are owner estimates, not sale prices. Rent includes utilities. Same-sex couple households count couples who report as such; this is not a count of LGBTQ+ residents.
Share of occupied homes. Source [7].
Show the data as a table
| Group | Share |
|---|---|
| Owner-occupied | 70.4% |
| Renter-occupied | 29.6% |
Median home value is $232,200, higher than 13% of the 455 covered markets with a Census value.
Show the data as a table
| Range | Markets |
|---|---|
| $119,700 to $213,715 | 47 |
| $213,715 to $307,730 | 69 |
| $307,730 to $401,745 | 75 |
| $401,745 to $495,760 | 79 |
| $495,760 to $589,775 | 40 |
| $589,775 to $683,790 | 39 |
| $683,790 to $777,805 | 26 |
| $777,805 to $871,820 | 18 |
| $871,820 to $965,835 | 21 |
| $965,835 to $1,059,850 | 8 |
| $1,059,850 to $1,153,865 | 3 |
| $1,153,865 to $1,247,880 | 4 |
| $1,247,880 to $1,341,895 | 5 |
| $1,341,895 to $1,435,910 | 3 |
| $1,435,910 to $1,529,925 | 3 |
| $1,529,925 to $1,623,940 | 3 |
| $1,623,940 to $1,717,955 | 1 |
| $1,717,955 to $1,811,970 | 0 |
| $1,811,970 to $1,905,985 | 1 |
| $1,905,985 to $2,000,000 | 10 |
Comparison charts use the 455 markets in our coverage list that have a Census value. They describe those markets, not the whole country.
LGBTQ+ legal climate in Moneta
State law for Virginia and local ordinances are published by the Movement Advancement Project (MAP).
Read the laws at the source
We do not republish MAP's legal data here. Open the MAP Equality Maps below and choose Virginia. Not legal advice; confirm with your state civil rights agency or a local fair housing organization.
- Movement Advancement Project, Equality Maps: Nondiscrimination Laws
- Movement Advancement Project, Equality Maps: Child Welfare Nondiscrimination Laws
- Movement Advancement Project, Equality Maps: Healthcare Laws and Policies
- Movement Advancement Project, Equality Maps: Conversion Therapy Laws
- Movement Advancement Project, Equality Maps: Local Nondiscrimination Ordinances
LGBTQ+ community map and venues in Moneta
Venues, centers, health and social services and Pride events tagged as LGBTQ+ in OpenStreetMap and Wikidata. Both are volunteer-maintained, so treat this as a starting point.
No venue records in our sources
No LGBTQ-tagged venues, centers, clinics or Pride events were found for this market in OpenStreetMap or Wikidata. These sources are volunteer-maintained, so this is a gap in the data, not a statement that none exist.
Climate in Moneta
Thirty-year averages (1991-2020) from the nearest NOAA station with normals, BEDFORD, 12 mi18.7 km from the city center at 896 ft273 m elevation.
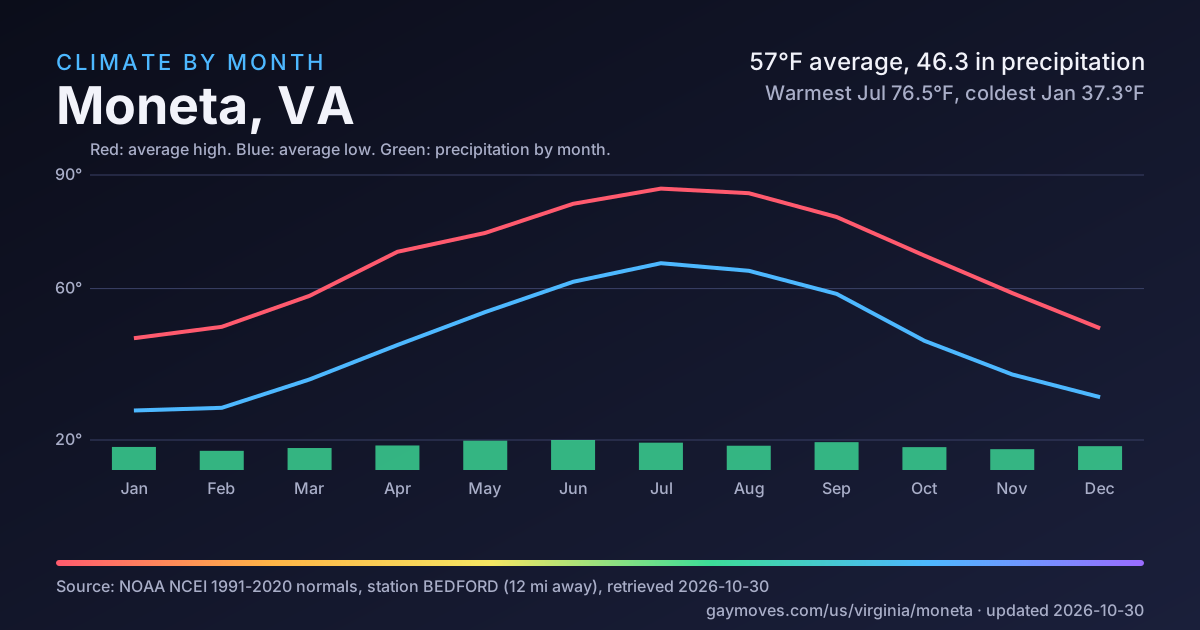
Red line: average high. Blue line: average low. Green bars: precipitation (tallest month 4.71 in).
Station BEDFORD, 12 mi from the city center. Normals for 1991-2020.
Show the data as a table
| Month | High °F | Low °F | Average °F | Precipitation (in) |
|---|---|---|---|---|
| Jan | 46.9 | 27.8 | 37.3 | 3.62 |
| Feb | 49.9 | 28.5 | 39.2 | 3.01 |
| Mar | 58.1 | 36 | 47.1 | 3.45 |
| Apr | 69.7 | 45.1 | 57.4 | 3.85 |
| May | 74.7 | 53.8 | 64.3 | 4.6 |
| Jun | 82.4 | 61.8 | 72.1 | 4.71 |
| Jul | 86.4 | 66.7 | 76.5 | 4.29 |
| Aug | 85.2 | 64.7 | 74.9 | 3.81 |
| Sep | 78.9 | 58.6 | 68.7 | 4.37 |
| Oct | 68.7 | 46.2 | 57.5 | 3.59 |
| Nov | 58.8 | 37.3 | 48.1 | 3.27 |
| Dec | 49.5 | 31.3 | 40.4 | 3.74 |
Red line: average high. Blue line: average low. Green bars: precipitation (tallest month 120 mm).
Station BEDFORD, 18.7 km from the city center. Normals for 1991-2020.
Show the data as a table
| Month | High °C | Low °C | Average °C | Precipitation (mm) |
|---|---|---|---|---|
| Jan | 8.3 | -2.3 | 2.9 | 92 |
| Feb | 9.9 | -1.9 | 4 | 76 |
| Mar | 14.5 | 2.2 | 8.4 | 88 |
| Apr | 20.9 | 7.3 | 14.1 | 98 |
| May | 23.7 | 12.1 | 17.9 | 117 |
| Jun | 28 | 16.6 | 22.3 | 120 |
| Jul | 30.2 | 19.3 | 24.7 | 109 |
| Aug | 29.6 | 18.2 | 23.8 | 97 |
| Sep | 26.1 | 14.8 | 20.4 | 111 |
| Oct | 20.4 | 7.9 | 14.2 | 91 |
| Nov | 14.9 | 2.9 | 8.9 | 83 |
| Dec | 9.7 | -0.4 | 4.7 | 95 |
- Average temperature
- 57°F13.9°C[9]Warmest Jul 76.5°F24.7°C, coldest Jan 37.3°F2.9°C
- Precipitation
- 46.3 in1,176 mm[9]Per year
- Days at 90°F32.2°C or hotter
- 19[9]Per year
- Days at or below freezing
- 85[9]Per year
- Heating degree days
- 4,062[9]Higher means more heating
- Cooling degree days
- 1,162[9]Higher means more cooling
Geography and getting to Moneta
- Plus sign: city center
Faded markers use the coordinate of the place a record is located in, not its own. No map tiles are used; the outline is Census TIGER geometry.
Distances are straight-line from the city center, not drive time.
Daily life in Moneta
How people get around, plus counts of mapped transit stops, parks and everyday destinations near the city center.
Share of workers 16 and over. Source [15].
Show the data as a table
| Item | Value (%) |
|---|---|
| Drive alone | 82.7 |
| Public transit | 0 |
| Walk | 17.3 |
| Bike | 0 |
| Work from home | 0 |
- Average commute
- 33.5 min[14]One way, people who travel to work
- Public transit stops
- 0[16]0 per sq mi0 per sq km within 1.2 mi2 km of the center
- Rail and subway stops
- 0[16]0 per sq mi0 per sq km within 1.2 mi2 km of the center
- Parks
- 1[16]0.3 per sq mi0.1 per sq km within 1.2 mi2 km of the center
- Everyday destinations
- 7[16]5.7 per sq mi2.2 per sq km within 0.6 mi1 km of the center
OpenStreetMap counts reflect what volunteers have mapped and the area measured, so compare them between places with care.
Moving to Moneta: a guide from the data
Every line below is generated from the sourced figures on this page. Nothing here is opinion or marketing.
What it costs
Getting there and getting around
- Fly into Roanoke–Blacksburg Regional Airport (ROA), 22.1 mi36 km from the city center in a straight line.[13]
- The nearest large hub is Piedmont Triad International Airport (GSO), 77.3 mi124 km away.[13]
- 82.7% of workers drive alone; 0% take transit.[15]
- OpenStreetMap maps 0 public transit stops within 1.2 mi2 km of the center.[16]
Weather to plan for
Questions to bring to any agent
General questions, not city data.
- Which neighborhoods fit my budget, and how do you know?
- How many LGBTQ+ clients have you represented, and can I speak to one?
- Which lenders and inspectors do you work with, and do you receive anything for referring them?
- How will you handle showings and offers if I am relocating from out of town?
- What is your fee, and when is it due?
Agents in Moneta
Not yet verified. No agent has claimed Moneta, VA on GayMoves, so we show none and invent none. Claiming starts a 30-day Pro trial with no card, and the first 25 agents to claim a city get 90 days instead (proposed terms).
Founding agent offerProposed terms
Be one of the first 25 agents in Moneta, VA
Claiming starts a 30-day Pro trial with no card, and the first 25 agents to claim a city get 90 days instead. After the trial Pro is $39 a month for up to 20 cities, and the Free plan stays free. Claiming means your own verified profile: no one is listed here on your behalf.
Share Moneta charts
Each card is a standalone image that prints its own sources and date. Save it, post it, or drop it in a message.
Housing snapshot Download SVG
Climate by month Download SVG
Moneta questions
Answers are generated from the sourced data on this page and name their source.
How many people live in Moneta?
The Census Bureau estimates 395 residents (margin of error plus or minus 164), across 3.8 sq mi9.9 km² of land. Sources: U.S. Census Bureau, American Community Survey 2020-2024 5-Year Estimates, Table B01003: Total Population (https://www2.census.gov/programs-surveys/acs/summary_file/2024/table-based-SF/data/5YRData/acsdt5y2024-b01003.dat), retrieved 2026-10-30; US Census Bureau, 2025 Gazetteer Files (Places) (https://www2.census.gov/geo/docs/maps-data/data/gazetteer/2025_Gazetteer/2025_Gaz_place_national.zip), retrieved 2026-10-30.
How much is rent in Moneta?
Median gross rent (rent plus utilities) is $1,363/mo, plus or minus $945. This is a survey estimate for the whole place, not a listing price. Source: U.S. Census Bureau, American Community Survey 2020-2024 5-Year Estimates, Table B25064: Median Gross Rent (Dollars) (https://www2.census.gov/programs-surveys/acs/summary_file/2024/table-based-SF/data/5YRData/acsdt5y2024-b25064.dat), retrieved 2026-10-30.
What is the median home value in Moneta?
Owners estimate the median value of owner-occupied homes at $232,200. These are owner estimates, not sale prices. Source: U.S. Census Bureau, American Community Survey 2020-2024 5-Year Estimates, Table B25077: Median Value (Dollars) of Owner-Occupied Housing Units (https://www2.census.gov/programs-surveys/acs/summary_file/2024/table-based-SF/data/5YRData/acsdt5y2024-b25077.dat), retrieved 2026-10-30.
Do most people in Moneta own or rent?
70.4% of occupied homes are lived in by their owners; the rest are rented. Source: U.S. Census Bureau, American Community Survey 2020-2024 5-Year Estimates, Table B25003: Tenure of Occupied Housing Units (https://www2.census.gov/programs-surveys/acs/summary_file/2024/table-based-SF/data/5YRData/acsdt5y2024-b25003.dat), retrieved 2026-10-30.
Are there LGBTQ+ venues and community spaces near Moneta?
Not in our sources: OpenStreetMap and Wikidata list no LGBTQ+ venue record for Moneta. These sources are volunteer-maintained, so this is a gap in the data and not proof that none exist.
What is the weather like in Moneta?
Using 1991-2020 normals from the BEDFORD station (12 mi18.7 km from the city center): the warmest month averages 76.5°F24.7°C (Jul) and the coldest 37.3°F2.9°C (Jan). Annual precipitation is 46.3 in1,176 mm. Source: NOAA NCEI U.S. Climate Normals 1991-2020, Monthly (https://www.ncei.noaa.gov/data/normals-monthly/1991-2020/access/USC00440551.csv), retrieved 2026-10-30.
What is the nearest airport to Moneta?
Roanoke–Blacksburg Regional Airport (ROA) is the nearest commercial airport in the OurAirports data, 22.1 mi36 km in a straight line from the city center (not drive time). Source: OurAirports (https://ourairports.com/airports/KROA/), retrieved 2026-10-30.
How do people get to work in Moneta?
82.7% of workers drive alone, 0% use public transit, 0% work from home. The average one-way commute for people who travel to work is 33.5 minutes. Sources: US Census Bureau, American Community Survey 2023 5-year estimates, table B08013 (aggregate travel time divided by workers who commute) (https://data.census.gov/table/ACSDT5Y2023.B08013?g=1600000US5152536), retrieved 2026-10-30; US Census Bureau, American Community Survey 2023 5-year estimates, table B08301 (means of transportation to work) (https://data.census.gov/table/ACSDT5Y2023.B08301?g=1600000US5152536), retrieved 2026-10-30.
Are there LGBTQ+ friendly real estate agents in Moneta on GayMoves?
Not yet verified. No agent has claimed Moneta, VA on GayMoves, so we show none and invent none. Claiming starts a 30-day Pro trial with no card, and the first 25 agents to claim a city get 90 days instead (proposed terms).
Markets near Moneta
Straight-line distance between place centers.
- Lynchburg, VAAbout 27 mi43 km away · Open market
- Winston Salem, NCAbout 83 mi134 km away · Open market
- Chapel Hill, NCAbout 93 mi149 km away · Open market
- Durham, NCAbout 93 mi149 km away · Open market
- Greater Triangle, NCAbout 108 mi174 km away · Open market
- Raleigh, NCAbout 108 mi174 km away · Open market
What we do not have yet
A block appears above only when it has enough sourced values. These do not, and we show nothing in their place.
LGBTQ+ legal climate
The Movement Advancement Project values are withheld until MAP confirms permission to republish them. Read them at the source (linked in that section).
Community map and venues
OpenStreetMap and Wikidata hold no LGBTQ+ venue record for this place (a gap in volunteer data, not proof that none exist).
Sources and last updated
Last updated 2026-10-30: the newest retrieval date of any source on this page. Numbers in square brackets point here.
[1] U.S. Census Bureau, American Community Survey 2020-2024 5-Year Estimates, Table B01003: Total Population
Retrieved 2026-10-30 · data as of ACS 2020-2024 5-Year Estimates · License: Public domain: U.S. Government work, not subject to copyright (17 U.S.C. 105). Credit: U.S. Census Bureau.
[2] U.S. Census Bureau, American Community Survey 2020-2024 5-Year Estimates, Table B01002: Median Age by Sex
Retrieved 2026-10-30 · data as of ACS 2020-2024 5-Year Estimates · License: Public domain: U.S. Government work, not subject to copyright (17 U.S.C. 105). Credit: U.S. Census Bureau.
[3] U.S. Census Bureau, American Community Survey 2020-2024 5-Year Estimates, Table B11001: Household Type (Including Living Alone)
Retrieved 2026-10-30 · data as of ACS 2020-2024 5-Year Estimates · License: Public domain: U.S. Government work, not subject to copyright (17 U.S.C. 105). Credit: U.S. Census Bureau.
[4] U.S. Census Bureau, American Community Survey 2020-2024 5-Year Estimates, Table B25010: Average Household Size of Occupied Housing Units by Tenure
Retrieved 2026-10-30 · data as of ACS 2020-2024 5-Year Estimates · License: Public domain: U.S. Government work, not subject to copyright (17 U.S.C. 105). Credit: U.S. Census Bureau.
[5] U.S. Census Bureau, American Community Survey 2020-2024 5-Year Estimates, Table B25077: Median Value (Dollars) of Owner-Occupied Housing Units
Retrieved 2026-10-30 · data as of ACS 2020-2024 5-Year Estimates · License: Public domain: U.S. Government work, not subject to copyright (17 U.S.C. 105). Credit: U.S. Census Bureau.
[6] U.S. Census Bureau, American Community Survey 2020-2024 5-Year Estimates, Table B25064: Median Gross Rent (Dollars)
Retrieved 2026-10-30 · data as of ACS 2020-2024 5-Year Estimates · License: Public domain: U.S. Government work, not subject to copyright (17 U.S.C. 105). Credit: U.S. Census Bureau.
[7] U.S. Census Bureau, American Community Survey 2020-2024 5-Year Estimates, Table B25003: Tenure of Occupied Housing Units
Retrieved 2026-10-30 · data as of ACS 2020-2024 5-Year Estimates · License: Public domain: U.S. Government work, not subject to copyright (17 U.S.C. 105). Credit: U.S. Census Bureau.
[8] U.S. Census Bureau, American Community Survey 2020-2024 5-Year Estimates, Table B09019: Household Type (Including Living Alone) by Relationship (same-sex spouse and unmarried partner)
Retrieved 2026-10-30 · data as of ACS 2020-2024 5-Year Estimates · License: Public domain: U.S. Government work, not subject to copyright (17 U.S.C. 105). Credit: U.S. Census Bureau.
[9] NOAA NCEI U.S. Climate Normals 1991-2020, Monthly
https://www.ncei.noaa.gov/data/normals-monthly/1991-2020/access/USC00440551.csv
Retrieved 2026-10-30 · License: Public domain (US Government work, NOAA)
[10] US Census Bureau, 2025 Gazetteer Files (Places)
https://www2.census.gov/geo/docs/maps-data/data/gazetteer/2025_Gazetteer/2025_Gaz_place_national.zip
Retrieved 2026-10-30 · License: Public domain (US Government work, 17 USC 105)
[11] US Census Bureau, TIGERweb Places (Incorporated Places, Consolidated Cities, CDPs)
Retrieved 2026-10-30 · License: Public domain (US Government work, 17 USC 105)
[12] USGS 3D Elevation Program, Elevation Point Query Service
Retrieved 2026-10-30 · License: Public domain (USGS, US Government work)
[13] OurAirports
https://ourairports.com/airports/KROA/
Retrieved 2026-10-30 · License: Public domain (OurAirports dedication)
[14] US Census Bureau, American Community Survey 2023 5-year estimates, table B08013 (aggregate travel time divided by workers who commute)
https://data.census.gov/table/ACSDT5Y2023.B08013?g=1600000US5152536
Retrieved 2026-10-30 · License: Public domain (US Government work, 17 U.S.C. 105)
[15] US Census Bureau, American Community Survey 2023 5-year estimates, table B08301 (means of transportation to work)
https://data.census.gov/table/ACSDT5Y2023.B08301?g=1600000US5152536
Retrieved 2026-10-30 · License: Public domain (US Government work, 17 U.S.C. 105)
[16] OpenStreetMap contributors via Overpass API
https://www.openstreetmap.org/?mlat=37.18058&mlon=-79.61994#map=14/37.18058/-79.61994
Retrieved 2026-10-30 · License: ODbL 1.0, (c) OpenStreetMap contributors
Full license notes for every dataset are in the project's data license register. Estimates can change when sources publish new vintages.